After undergoing a significant decline, breaching multiple crucial support levels, Ripple’s price has found stability near the important $0.5 mark. However, the cryptocurrency is currently in a sideways consolidation phase around this threshold, displaying minimal volatility.
Ripple Price Analysis: Technicals
By Shayan
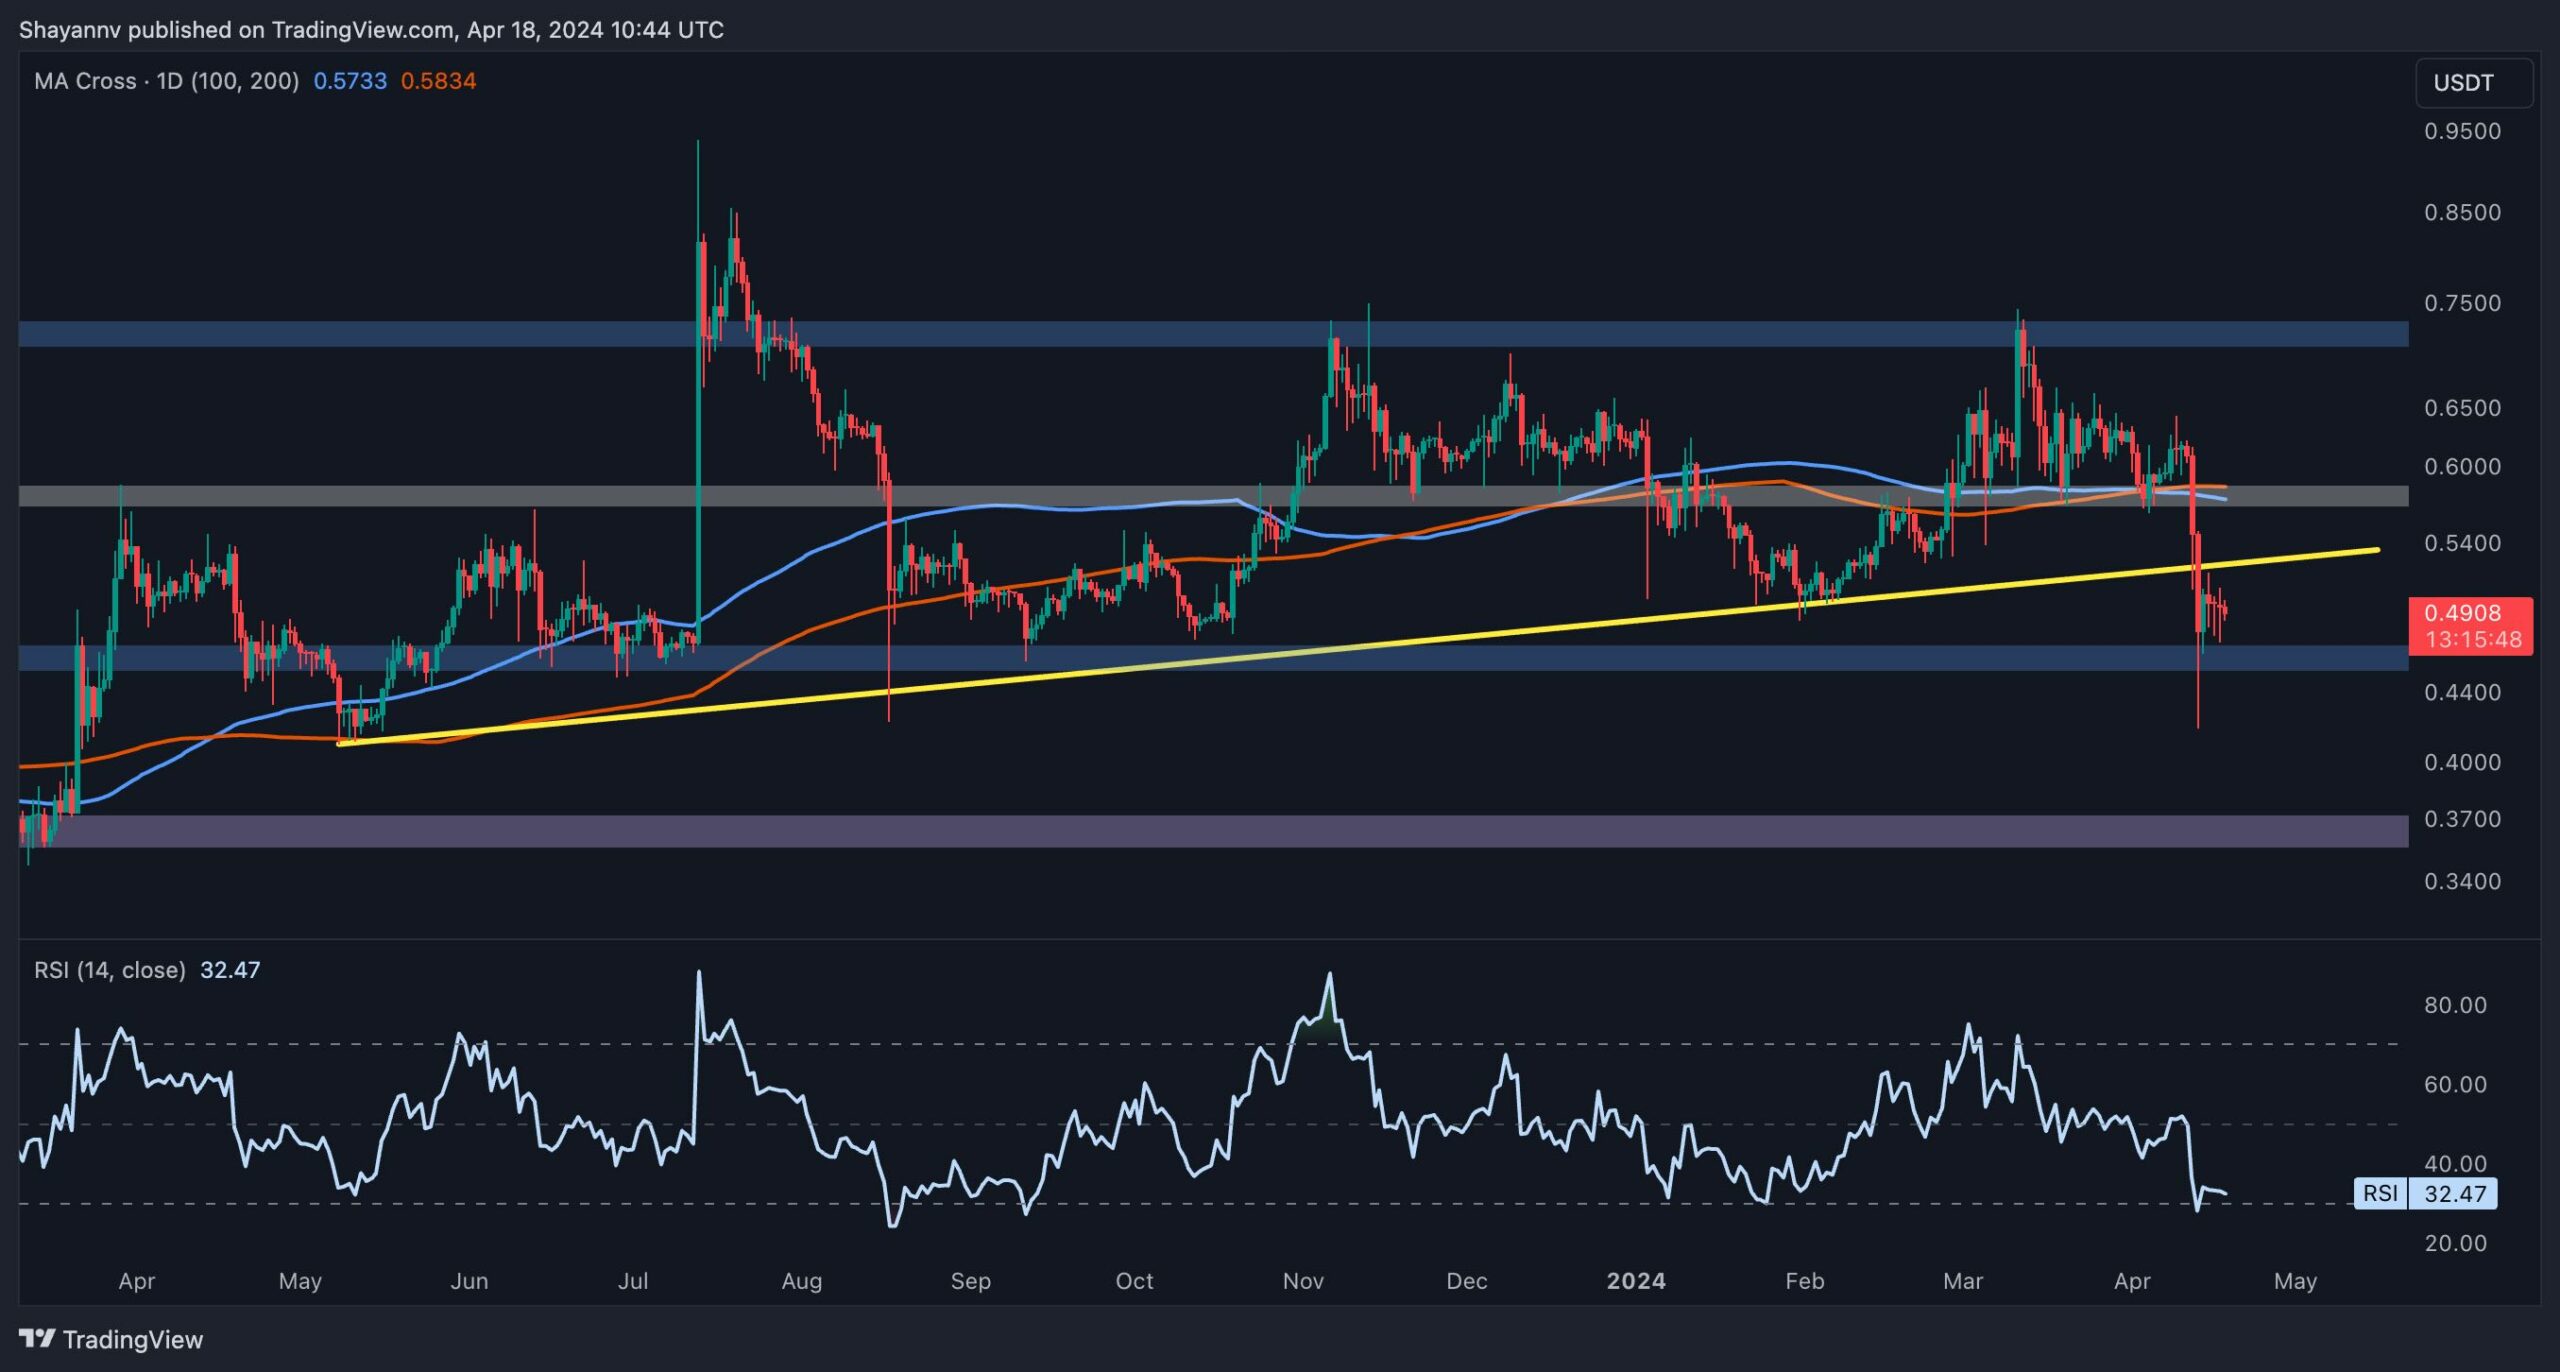
The Daily Chart
A detailed analysis of the daily chart indicates that after a substantial downward movement, Ripple has reached a critical juncture around the $0.5 mark, where it has found support and entered a consolidation phase. Despite this, the price lacks significant momentum and is accompanied by minor fluctuations.
Yet, XRP appears poised to complete a pullback to the previously breached ascending trendline at $0.53, potentially signaling another downward movement.
Additionally, the RSI indicator has dipped into oversold territory, suggesting the possibility of corrective retracements. Nonetheless, the cryptocurrency is anticipated to continue consolidating within the range bounded by the $0.5 support level and the ascending trendline until a breakout occurs.

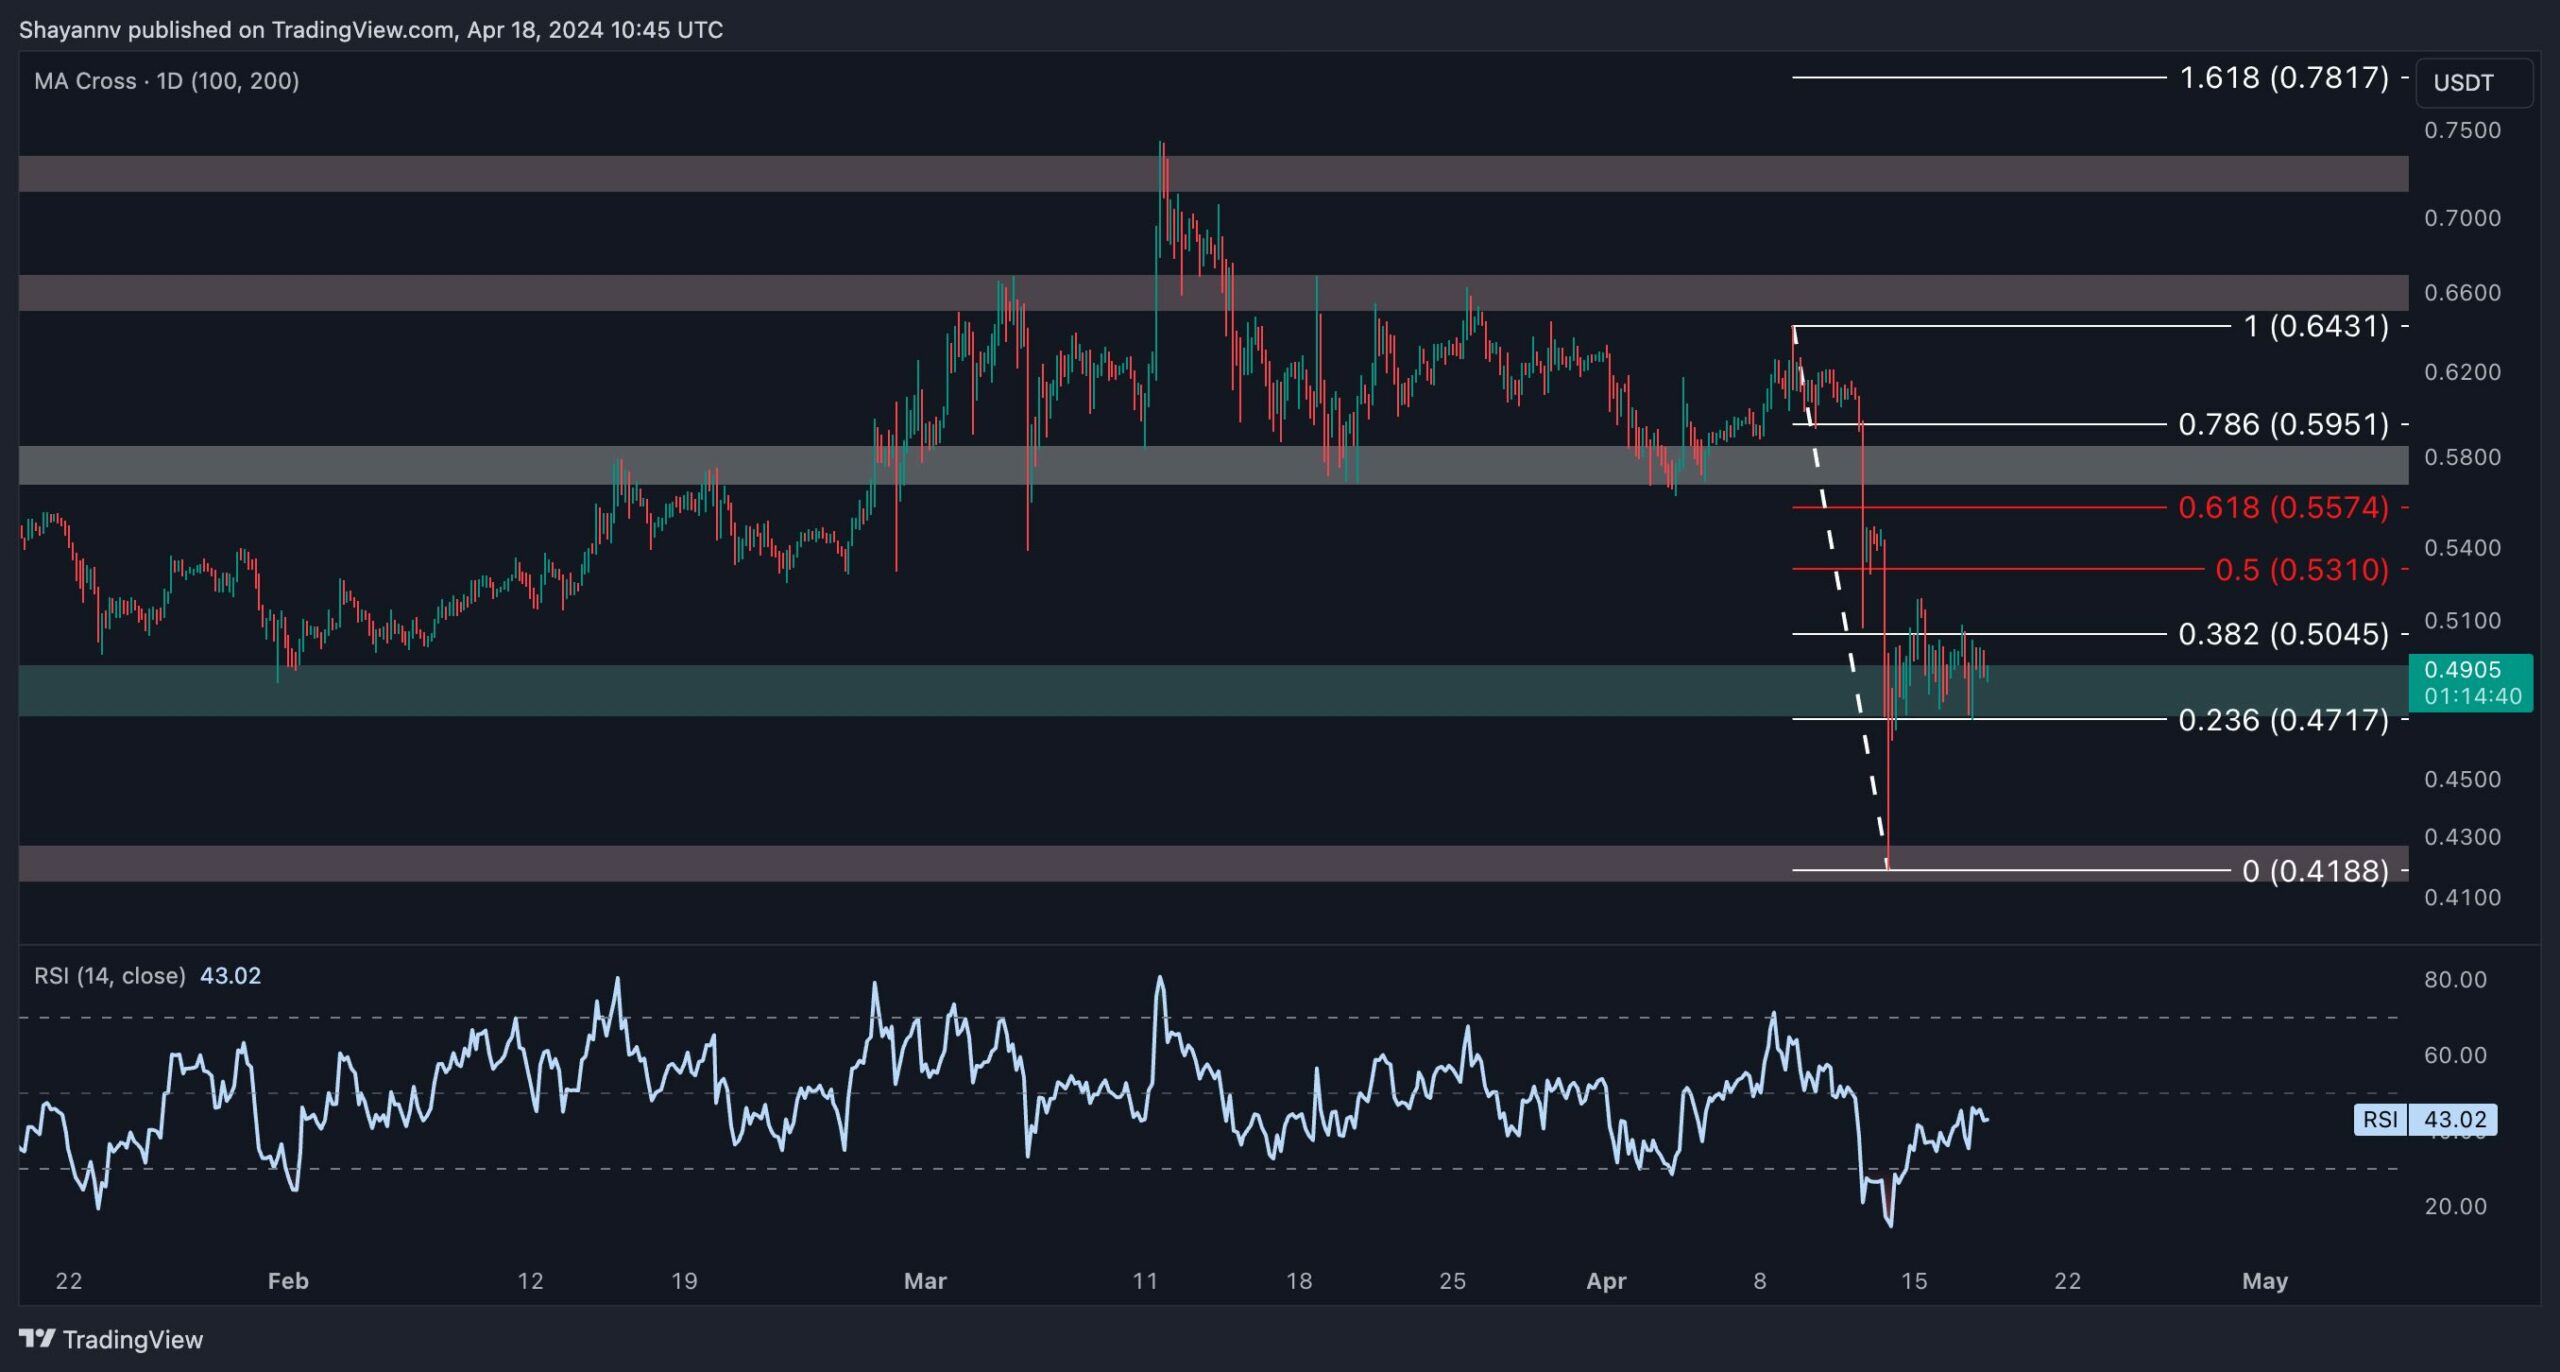
The 4-Hour Chart
A closer examination of the 4-hour chart reveals that following a substantial drop, which resulted in the liquidation of many long positions in perpetual markets, Ripple experienced a notable and immediate rebound near the $0.42 mark, subsequently stabilizing around $0.5.
Despite this, XRP’s price has exhibited subdued movement, indicating uncertainty among market participants and a lack of clear directional momentum. Therefore, given the steep nature of the recent decline, the market may require a period of corrective movement before determining its subsequent trajectory.
Accordingly, the cryptocurrency is anticipated to continue its corrective retracement, with potential targets lying within the price range defined by the 0.5 ($0.54) and 0.618 ($0.55) Fibonacci levels.

The post Ripple Price Analysis: What’s Next for XRP Following the Recent Crash? appeared first on CryptoPotato.
 Moonshot Investments: Top Crypto Picks for 2024