As seen from the drop in the global market cap, markets are still facing consolidation. As of press time, the global market cap had dropped to 0.4% within the last 24 hours to stand at $2.49T as of press time.
Bitcoin Price Review
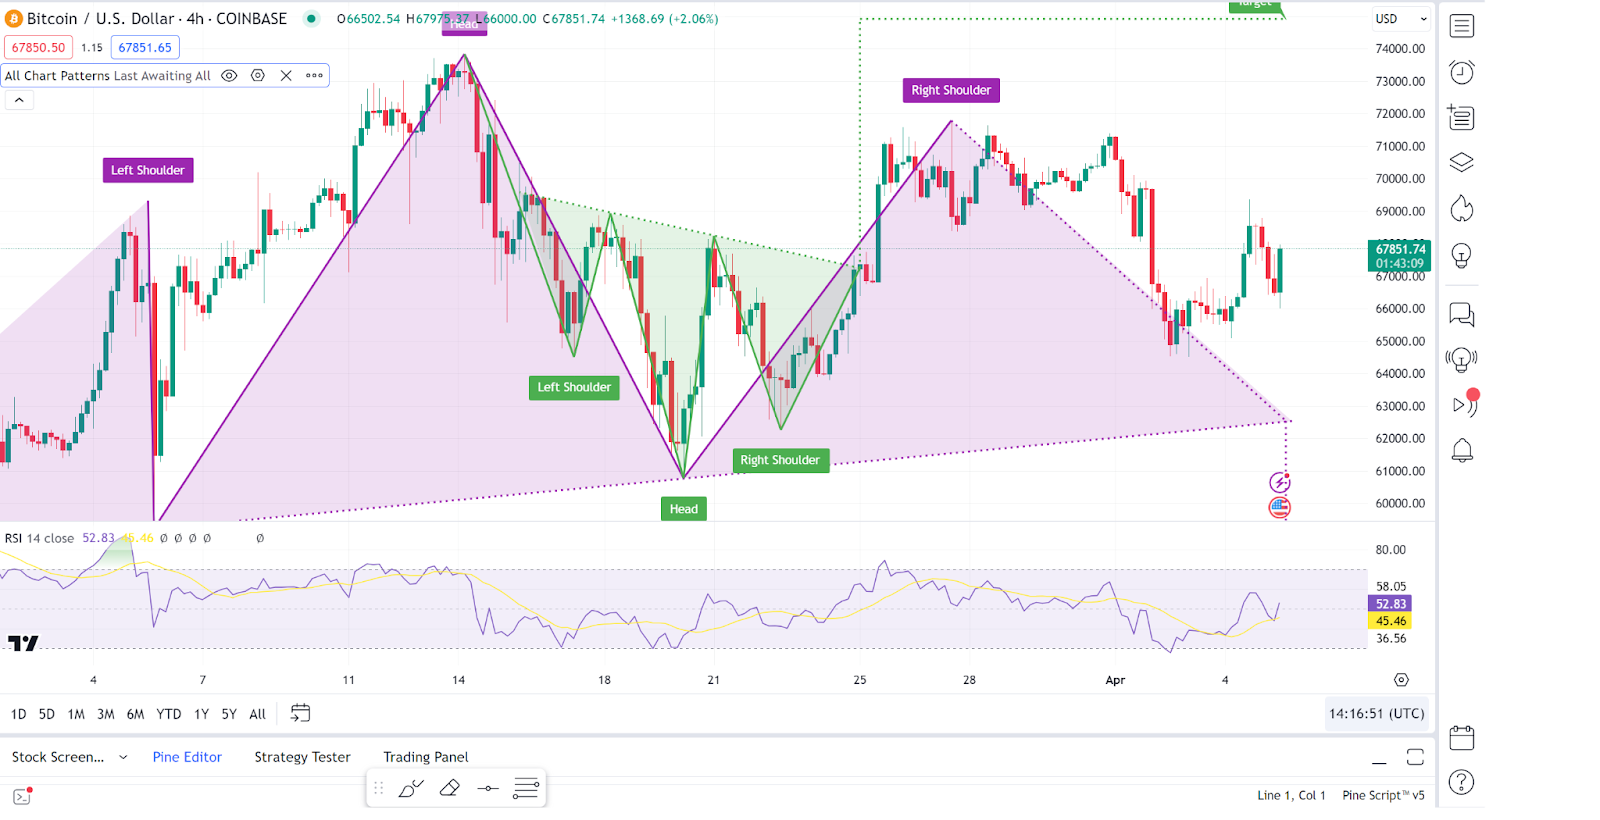
Bitcoin (BTC), is still in a consolidation phase as evidenced by the minimal price movements today. The bitcoin chart displays a head and shoulders pattern, which is generally considered a bearish reversal pattern. This pattern is completed when the price falls below the neckline after forming the second shoulder.
The Relative Strength Index (RSI) is around 52, which indicates neither overbought nor oversold conditions. It seems to be moving downwards, suggesting potential for bearish momentum. The Bitcoin price is currently above the pattern’s neckline, indicating that the pattern has not yet been confirmed. A break below could confirm the bearish outlook. As of press time, the Bitcoin price stood at $67,838, representing a minor 0.2% pump from its previous 24-hour price.
Ethereum Price Review
Ethereum, however, succumbed to bear dominance in today’s session, as evidenced by its price drop. The Ethereum chart shows Bollinger Bands, with price action recently bouncing off the lower band, indicating possible oversold conditions.
The Moving Average Convergence Divergence (MACD) is below the signal line and has been in bearish territory. However, the bars seem shortening, suggesting a weakening bearish momentum. The Ethereum price is below the 20-period simple moving average (SMA), which may act as resistance. A move above the SMA could indicate bullish potential. The Ethereum price stood at $3,290 as of press time, representing a 2.39% decrease from its previous 24-hour price.

Toncoin Price Prediction
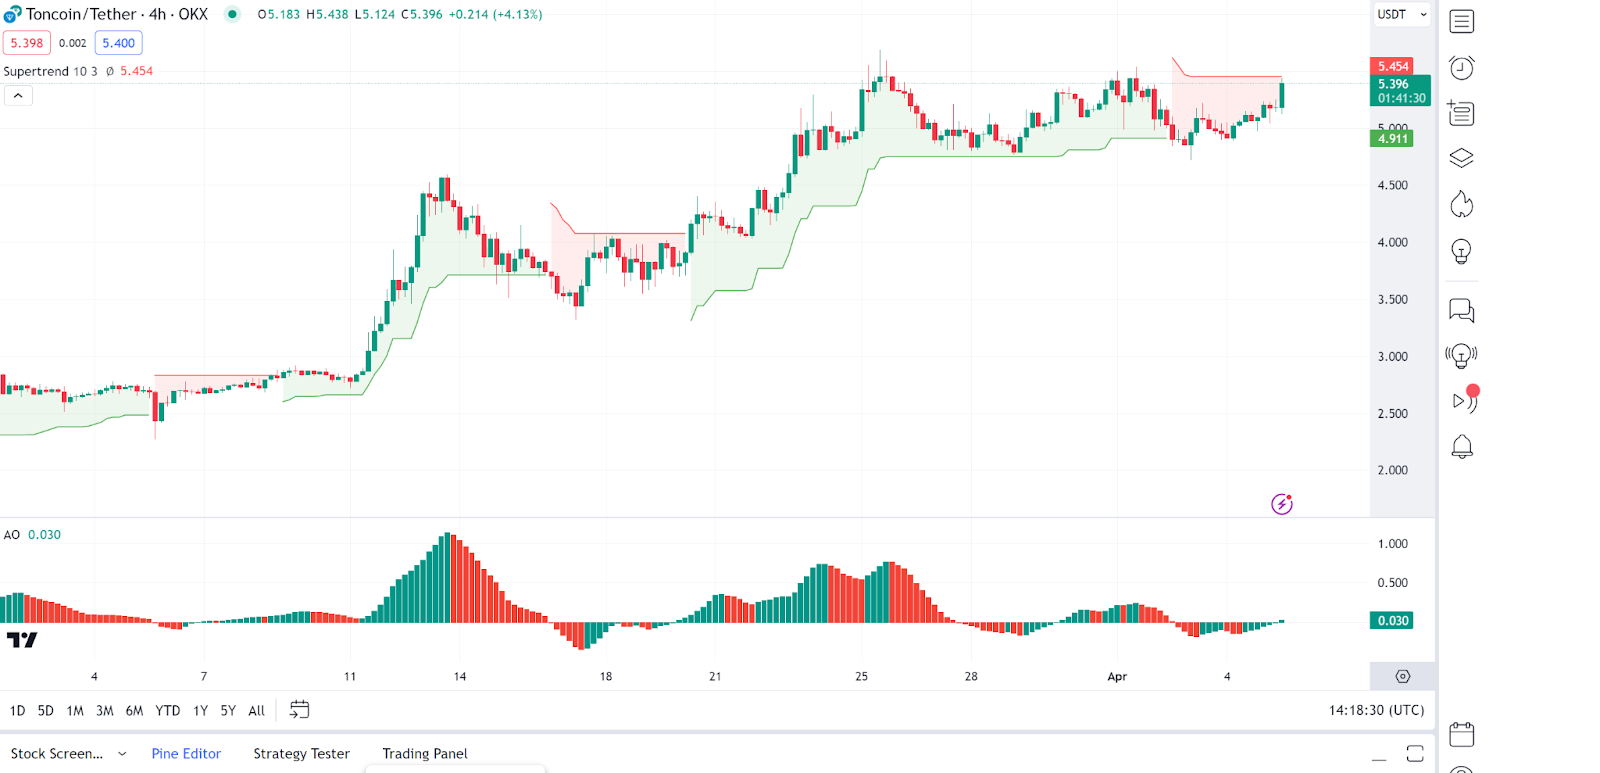
Toncoin (TON) is among the top gainers, posting remarkable gains in today’s session. The SuperTrend indicator is green and below the price, a bullish sign. The Bitcoin price oscillates around the SuperTrend line, and a consistent break above could confirm further bullishness.
The Awesome Oscillator (AO) shows green bars above the zero line, indicating bullish momentum. As of press time, the Toncoin price stood at $5.41, representing a 5.9% increase from its previous 24-hour price.
Bitcoin Cash Price Review
Bitcoin Cash is among the top gainers today, posting remarkable gains. The Alligator indicator shows the price is currently between the green and red lines, suggesting a lack of a clear trend or consolidation phase.
The Money Flow Index (MFI) is around 64, slightly leaning towards overbought conditions, but not decisively. The Bitcoin Cash price seems to be consolidating after a recent uptrend, and a break above the green Alligator line may signal a continuation of the bullish trend. As of press time, the Bitcoin Cash price stood at $665, representing a 4% increase from its previous 24-hour price.

eCash Price Review
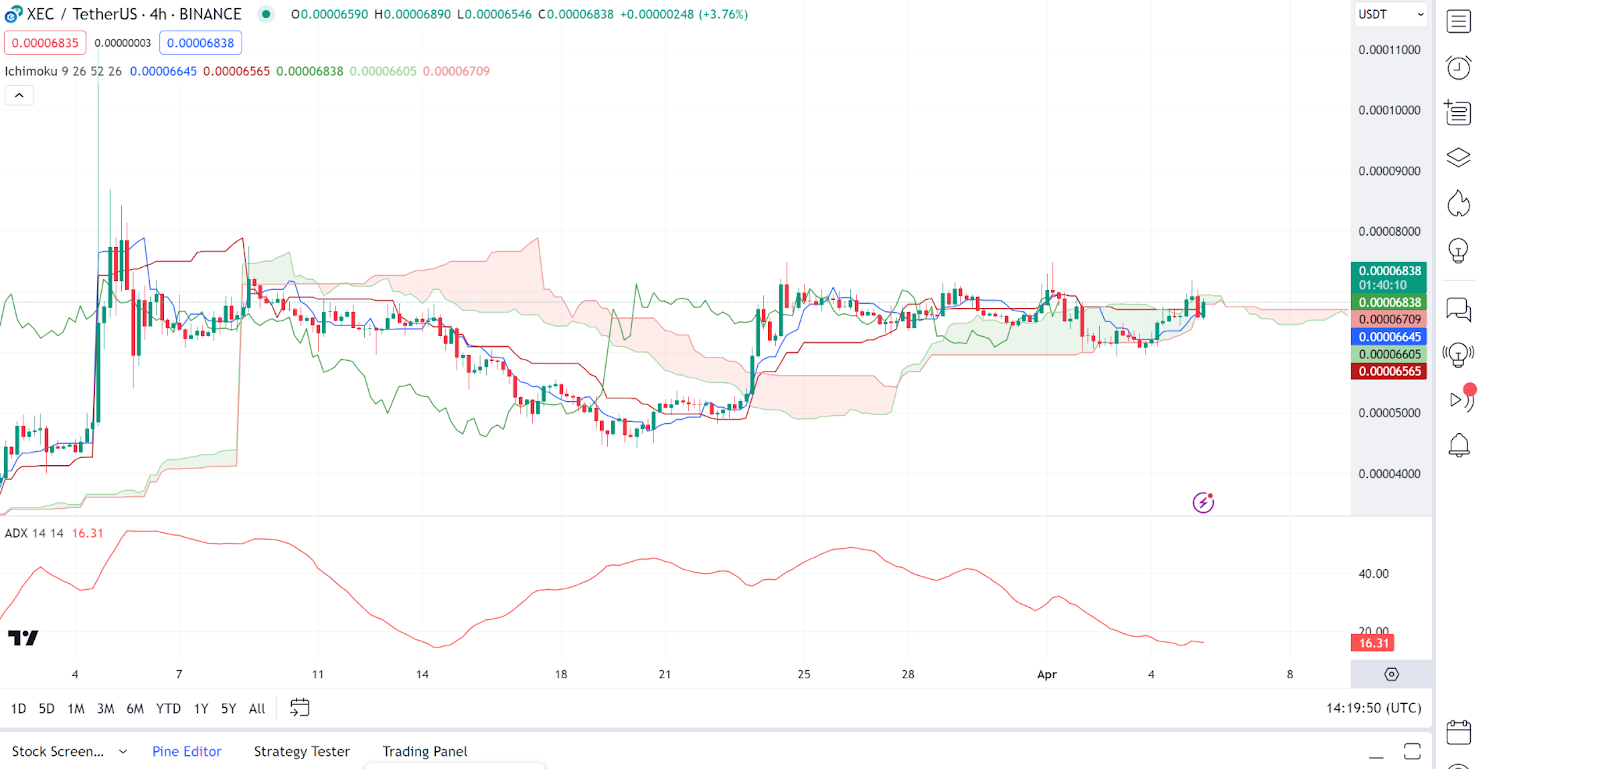
eCash (XEC) also managed some notable gains in today’s session, as the token also managed some notable gains. Analyzing eCash charts, the Ichimoku Cloud shows mixed signals with the price fluctuating around the cloud, indicating a lack of a strong trend.
The Average Directional Index (ADX) is around 16, suggesting a weak or absent trend. The eCash price is currently in the middle of the cloud. A break above the cloud could be a bullish signal, while a drop below could be bearish. As of press time, the eCash price stood at $0.00006845, representing a 3.74% increase from its previous 24-hour price.